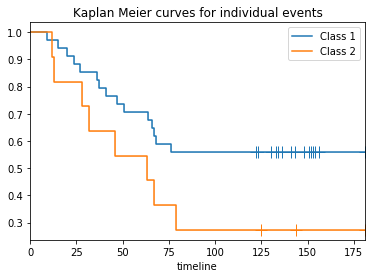
In this write-up we demonstrate how MPC can be used for descriptive analytics. We show how to apply MPC on Kaplan-Meier survival analysis and still gain insight from data.
Kaplan-Meier

what is kaplan meier
curve shows… including events when patient drops out.
A logrank test can determine if two curves are different.
The problem
A challenge arises when privacy prohibits hospitals to combine the results of medical studies, e.g. to determine the effect of treatment options. In order of privacy leakage we are faced with three leaks:
- the input data: the occurance of an event at a certain time may be related to an individual. This should stay with the input party.
- the Kaplan Meier curves output: similarly as the input data (see figure). This should preserve privacy of the indivuals, but still offer insight.
- the logrank test output: The statistic by itself preserves privacy of the individuals.
preserve privacy
test
test
Demo
data
In [1]:
import sys
from scipy.stats import chi2
sys.argv = sys.argv + ['-c', 'party3_0.ini']
from mpyc.runtime import mpc
await mpc.start()
%matplotlib inline
from km import read_config, load_and_share, combine_series, plot_km, aggregate_events, logrank, to_lifelines_in_clear
In [2]:
filename, npoints, step, ninputters = read_config('kmtest2-params.txt')
series = load_and_share(filename, ninputters, npoints)
inputs = combine_series(series)
In [3]:
T1, E1, T2, E2 = await to_lifelines_in_clear(inputs)
plot_km(T1, E1, T2, E2, 'Kaplan Meier curves for individual events')
In [4]:
T1, E1, T2, E2, anon = await aggregate_events(inputs, step)
plot_km(T1, E1, T2, E2, 'Kaplan Meier curves for aggregated events', True)
In [5]:
c2 = await logrank(inputs, anon, step)
print(f'Chi2 statistic={c2}, p-value={1-chi2.cdf(c2,1)}')
await mpc.shutdown()
In [ ]:
